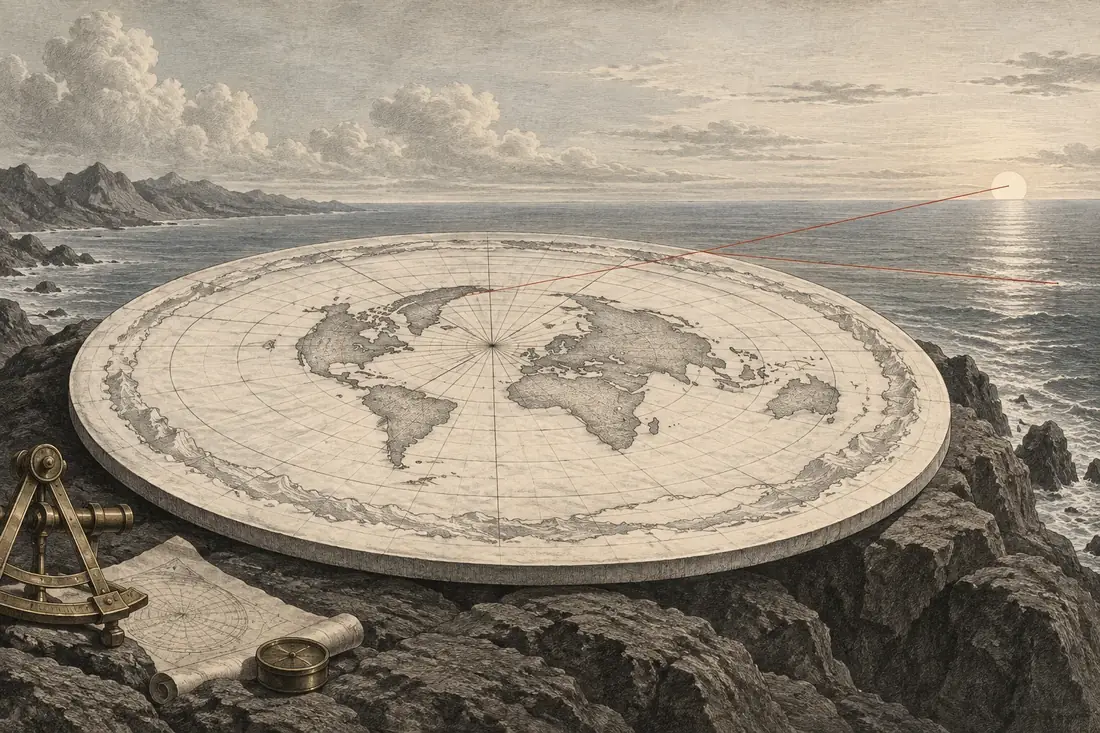
A familiar drawing becomes a physical surface
The claim is that a north-centred disk map can serve as the literal shape of the world because it places familiar continents in familiar directions. Some distances on such a map work well by construction. That success is treated as evidence that the rest of its distances need no separate examination.
A map can be useful while changing geometry. The meaningful question is what happens when one fixed scale must describe movement in every direction. If a drawing needs a different scale along different paths, reading all of it as one physical surface changes the lengths of those paths.
Equidistant has a centre
The azimuthal equidistant projection preserves distance and direction from its chosen centre. In its north-polar form, meridians radiate outward and latitude circles become concentric rings. A point’s map radius is proportional to its distance along a meridian from the North Pole. This is a genuine and useful property, not a mistake in the map.
But the guarantee is tied to that centre. Cartographic documentation distinguishes the straight radial directions, where scale is true, from the growing distortion away from the centre in other directions. The same general tradeoff occurs in other projections: preserving one selected property does not preserve every area, direction, shape and distance.
A parallel of latitude makes a particularly clean test because it is a circle in both constructions. On the sphere, its radius shrinks toward either pole. On the north-polar map, its radius keeps increasing as latitude moves south. The northern and southern halves therefore cannot retain matching parallel lengths under one radial scale.
Follow the parallel in both drawings
Choose a latitude and an angular span of longitude. The instrument follows the latitude circle, not the shortest flight route between its endpoints. For spherical Earth radius R and latitude φ, the parallel radius is R cos φ. On the north-centred equidistant map, the corresponding ring radius is R(π/2 − φ), with angles expressed in radians.
Multiply each radius by the chosen longitude span in radians to obtain the two arc lengths. At the opening example of 45 degrees south and a 90-degree longitude span, the spherical parallel arc is about 7,076 kilometres. The map arc, read using the true radial scale, is about 23,580 kilometres. The map stretches that same parallel arc by a factor of about 3.33.
Changing the longitude span lengthens or shortens both arcs in direct proportion, so the distortion factor stays the same at a given latitude. Changing latitude is what changes the disagreement. The northern comparison preset demonstrates why the map looks more convincing around its centre: at 45 degrees north, the factor is about 1.11.
The map’s centimetres are not in dispute. These kilometre values ask what those centimetres would mean if the radial scale were also valid sideways. A mapmaker handles the distinction by specifying the projection. Treating the page as a literal terrain model removes that distinction and turns a documented distortion into a prediction about travel.
The missing scale returns in the southern arcs
At 45 degrees south, the north-polar equidistant map stretches a latitude arc by a factor of about 3.33 when read at its true radial scale. The 90-degree example becomes about 23,580 kilometres on the disk, compared with about 7,076 kilometres along the spherical parallel. Changing the arc length leaves that multiplier unchanged.
The projection preserves distances from the North Pole by allowing distances around its rings to expand. Those two directions cannot share one uniform scale. Its orderly meridians and recognisable continents make it useful as a map; their appearance does not remove the measurable sideways stretch.
What the cities show
The tool measures every pair on the same north-polar map. Sydney to Santiago is 11,347 km over the surface, but 25,684 km on the disc, a stretch of 2.26 times. Cape Town to Buenos Aires is 6,870 km on a sphere and 17,167 km on the disc, 2.50 times. A northern pair such as London to New York is 5,570 km against 5,944 km, only 7 percent off, which is why the map looks reasonable from a northern city.
The error follows geometry. The map keeps each city’s distance from the North Pole exactly right, so pole-to-city lines are true. Everything else is stretched sideways by an amount that grows with distance from the pole, and the south, spread around the rim, is stretched most.
Why people believe it
The flat earth map is a real projection. The azimuthal equidistant projection centred on the North Pole is the map on the United Nations emblem, and it is accurate for distances measured from its centre. Because it is familiar from emblems and polar charts, it feels like a picture of the world rather than one of many ways to draw it, and a northern viewer sees nothing wrong. The test of a map is its southern distances, which flights supply: a documented Qantas flight from Buenos Aires to Darwin flew 15,037 km, 2.4 percent beyond the 14,683 km shortest route.