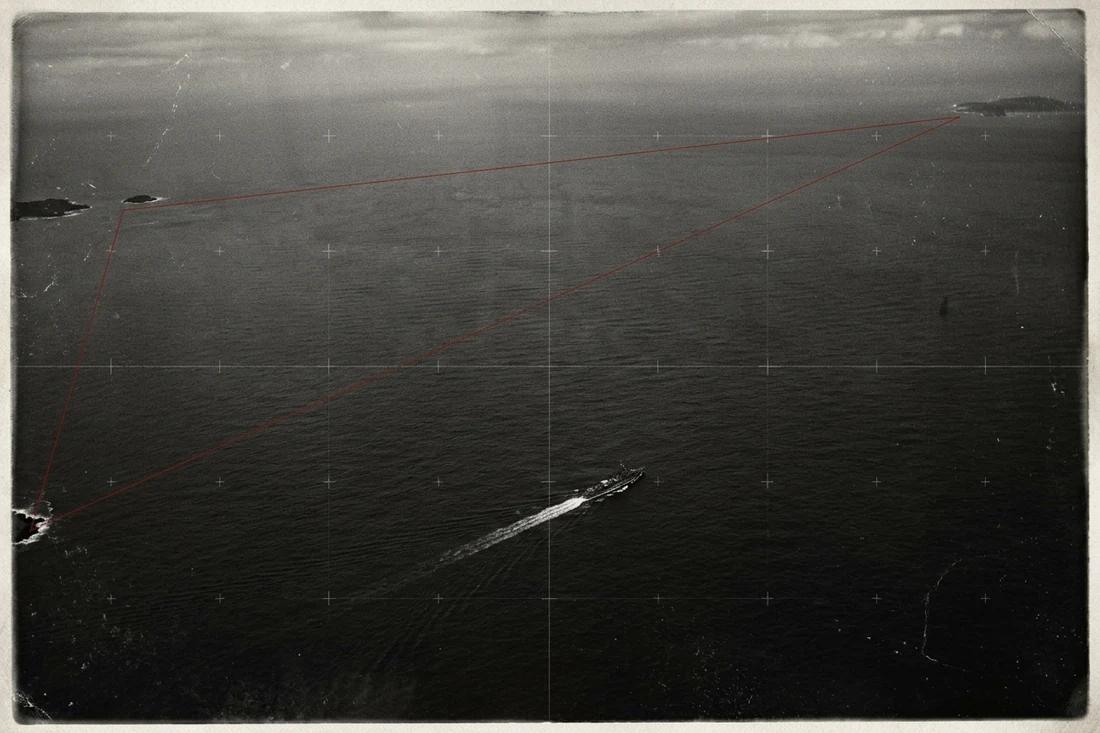
The outline is claimed to identify a special danger
The claim is that a particular triangular region of the Atlantic produces an unusual number of disappearances through a force not found in ordinary ocean navigation. A long list of incidents can make that proposition feel numerical. It is still only half a rate. Without the number of voyages, their duration and a comparable region, the list cannot show how often an individual journey encounters trouble.
Real ocean conditions fit inside a drawn border
NOAA identifies familiar hazards in the region, including tropical storms and hurricanes, changes associated with the Gulf Stream, and shallow waters that complicate navigation. None becomes less real because it has been attached to a famous label. The strongest version of the case begins with that difficult marine environment, rather than pretending the Atlantic is harmless.
The region also lacks an official boundary. Moving a line can include another event while simultaneously including more traffic. Changing the outline after examining the incidents creates a second problem: the area selected for a striking history is no longer an independently chosen test of whether that history is unusual.
NOAA reports no evidence that mysterious disappearances occur more frequently there than in other large, heavily travelled ocean areas. That is a comparative finding. It does not require a complete explanation for every event ever reported in the region. It asks whether the category, measured against comparable activity, establishes an excess.
Count voyages as well as incidents
The instrument compares two hypothetical regions over the same period, using the same definition of an incident. The opening example assigns the triangle-labelled region 20 incidents in one million voyages, and a comparison region 10 incidents in 250,000 voyages. These are adjustable examples, not an inventory of Atlantic losses.
The larger incident count produces the lower rate. The first region has 2 incidents per 100,000 voyages; the second has 4. Their rate ratio is 0.5. If both regions instead carried one million voyages, the ratio would become 2. The count of incidents has not changed. The missing denominator has changed the conclusion.
For this simple comparison, a voyage is the exposure unit. A serious comparison would define that unit consistently: two short coastal journeys need not represent the same time at sea as two ocean crossings. Ship type, weather and reporting practices also determine whether the two sets are comparable. Those are variables to match in the evidence, not quantities that can be repaired by drawing a more dramatic boundary.
Increasing the first region’s voyage count reduces its rate in direct proportion. Increasing its incident count raises the rate. The comparator works the same way. A ratio above one means only that the selected counts imply a higher observed rate; it does not identify the cause or establish that a small difference exceeds chance variation.
Compare incident rates fairly
Both regions use the same incident definition and period. All opening counts are illustrative; enter matching voyage counts for the same populations.
A value below one means fewer incidents per voyage in A; above one means more.
The incident count after allowing for the selected traffic volume.
The comparator rate on the same exposure scale.
Working tape
- Region A incidents per voyage
20 ÷ 1,000,000 = 0.00002 - Region B incidents per voyage
10 ÷ 250,000 = 0.00004 - Region A per 100,000 voyages
0.00002 × 100,000 = 2 - Region B per 100,000 voyages
0.00004 × 100,000 = 4 - Region A rate divided by region B rate
0.00002 ÷ 0.00004 = 0.5
A larger dossier can describe a lower rate
Twenty incidents in a million hypothetical voyages give 2 incidents per 100,000 voyages. Ten incidents in 250,000 give 4. The region with twice the incidents has half the incident rate because it carries four times the traffic. An incident list becomes a comparative result only when its exposure is counted too.
NOAA’s regional assessment finds no evidence of an exceptional disappearance rate. Weather and navigation supply real hazards; traffic supplies opportunities for incidents; the triangle supplies the shape of the filing cabinet. The first two must be measured before the third can explain anything.
Why people believe it
The name came from a 1964 magazine article by Vincent Gaddis, and the story was carried into popular culture by Charles Berlitz’s 1974 book. Both leaned on Flight 19, the five Navy bombers that disappeared on a training flight on 5 December 1945, and on a list of ships and aircraft. The list is vivid because each case is a person lost at sea, and the region is among the busiest sea and air routes in the world, which supplies a continuous stream of incidents. In 1975 Lawrence Kusche went back to the original reports in his book The Bermuda Triangle Mystery: Solved and found that many cases lay outside the region, occurred in storms, or had never happened as told.
Where to test it
The rate calculation puts a denominator under every count. A region with more traffic should record more incidents; the question is whether it records more per voyage than comparable waters. Change the traffic numbers in the calculator and note how much the headline ratio depends on them.